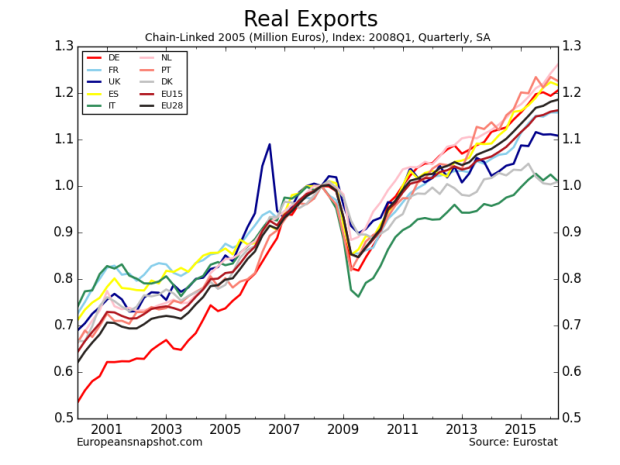
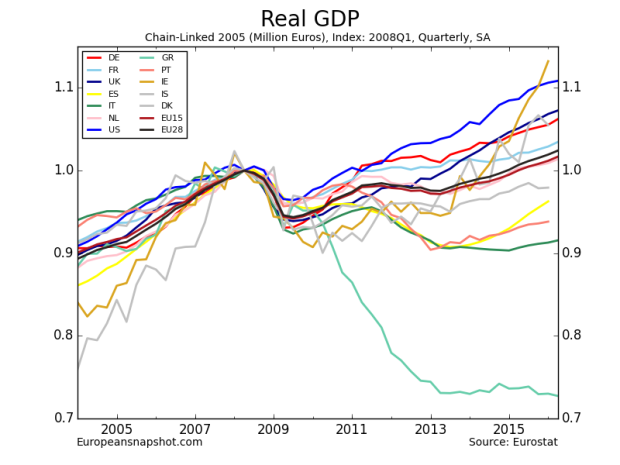
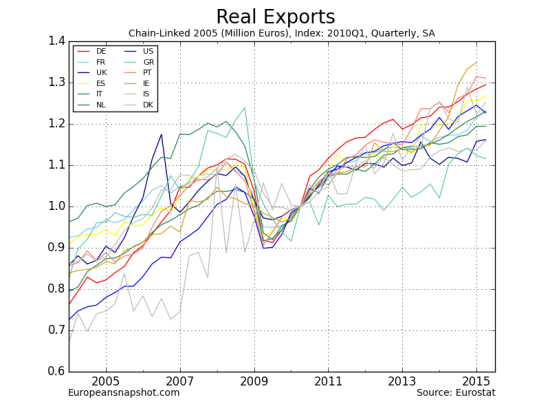
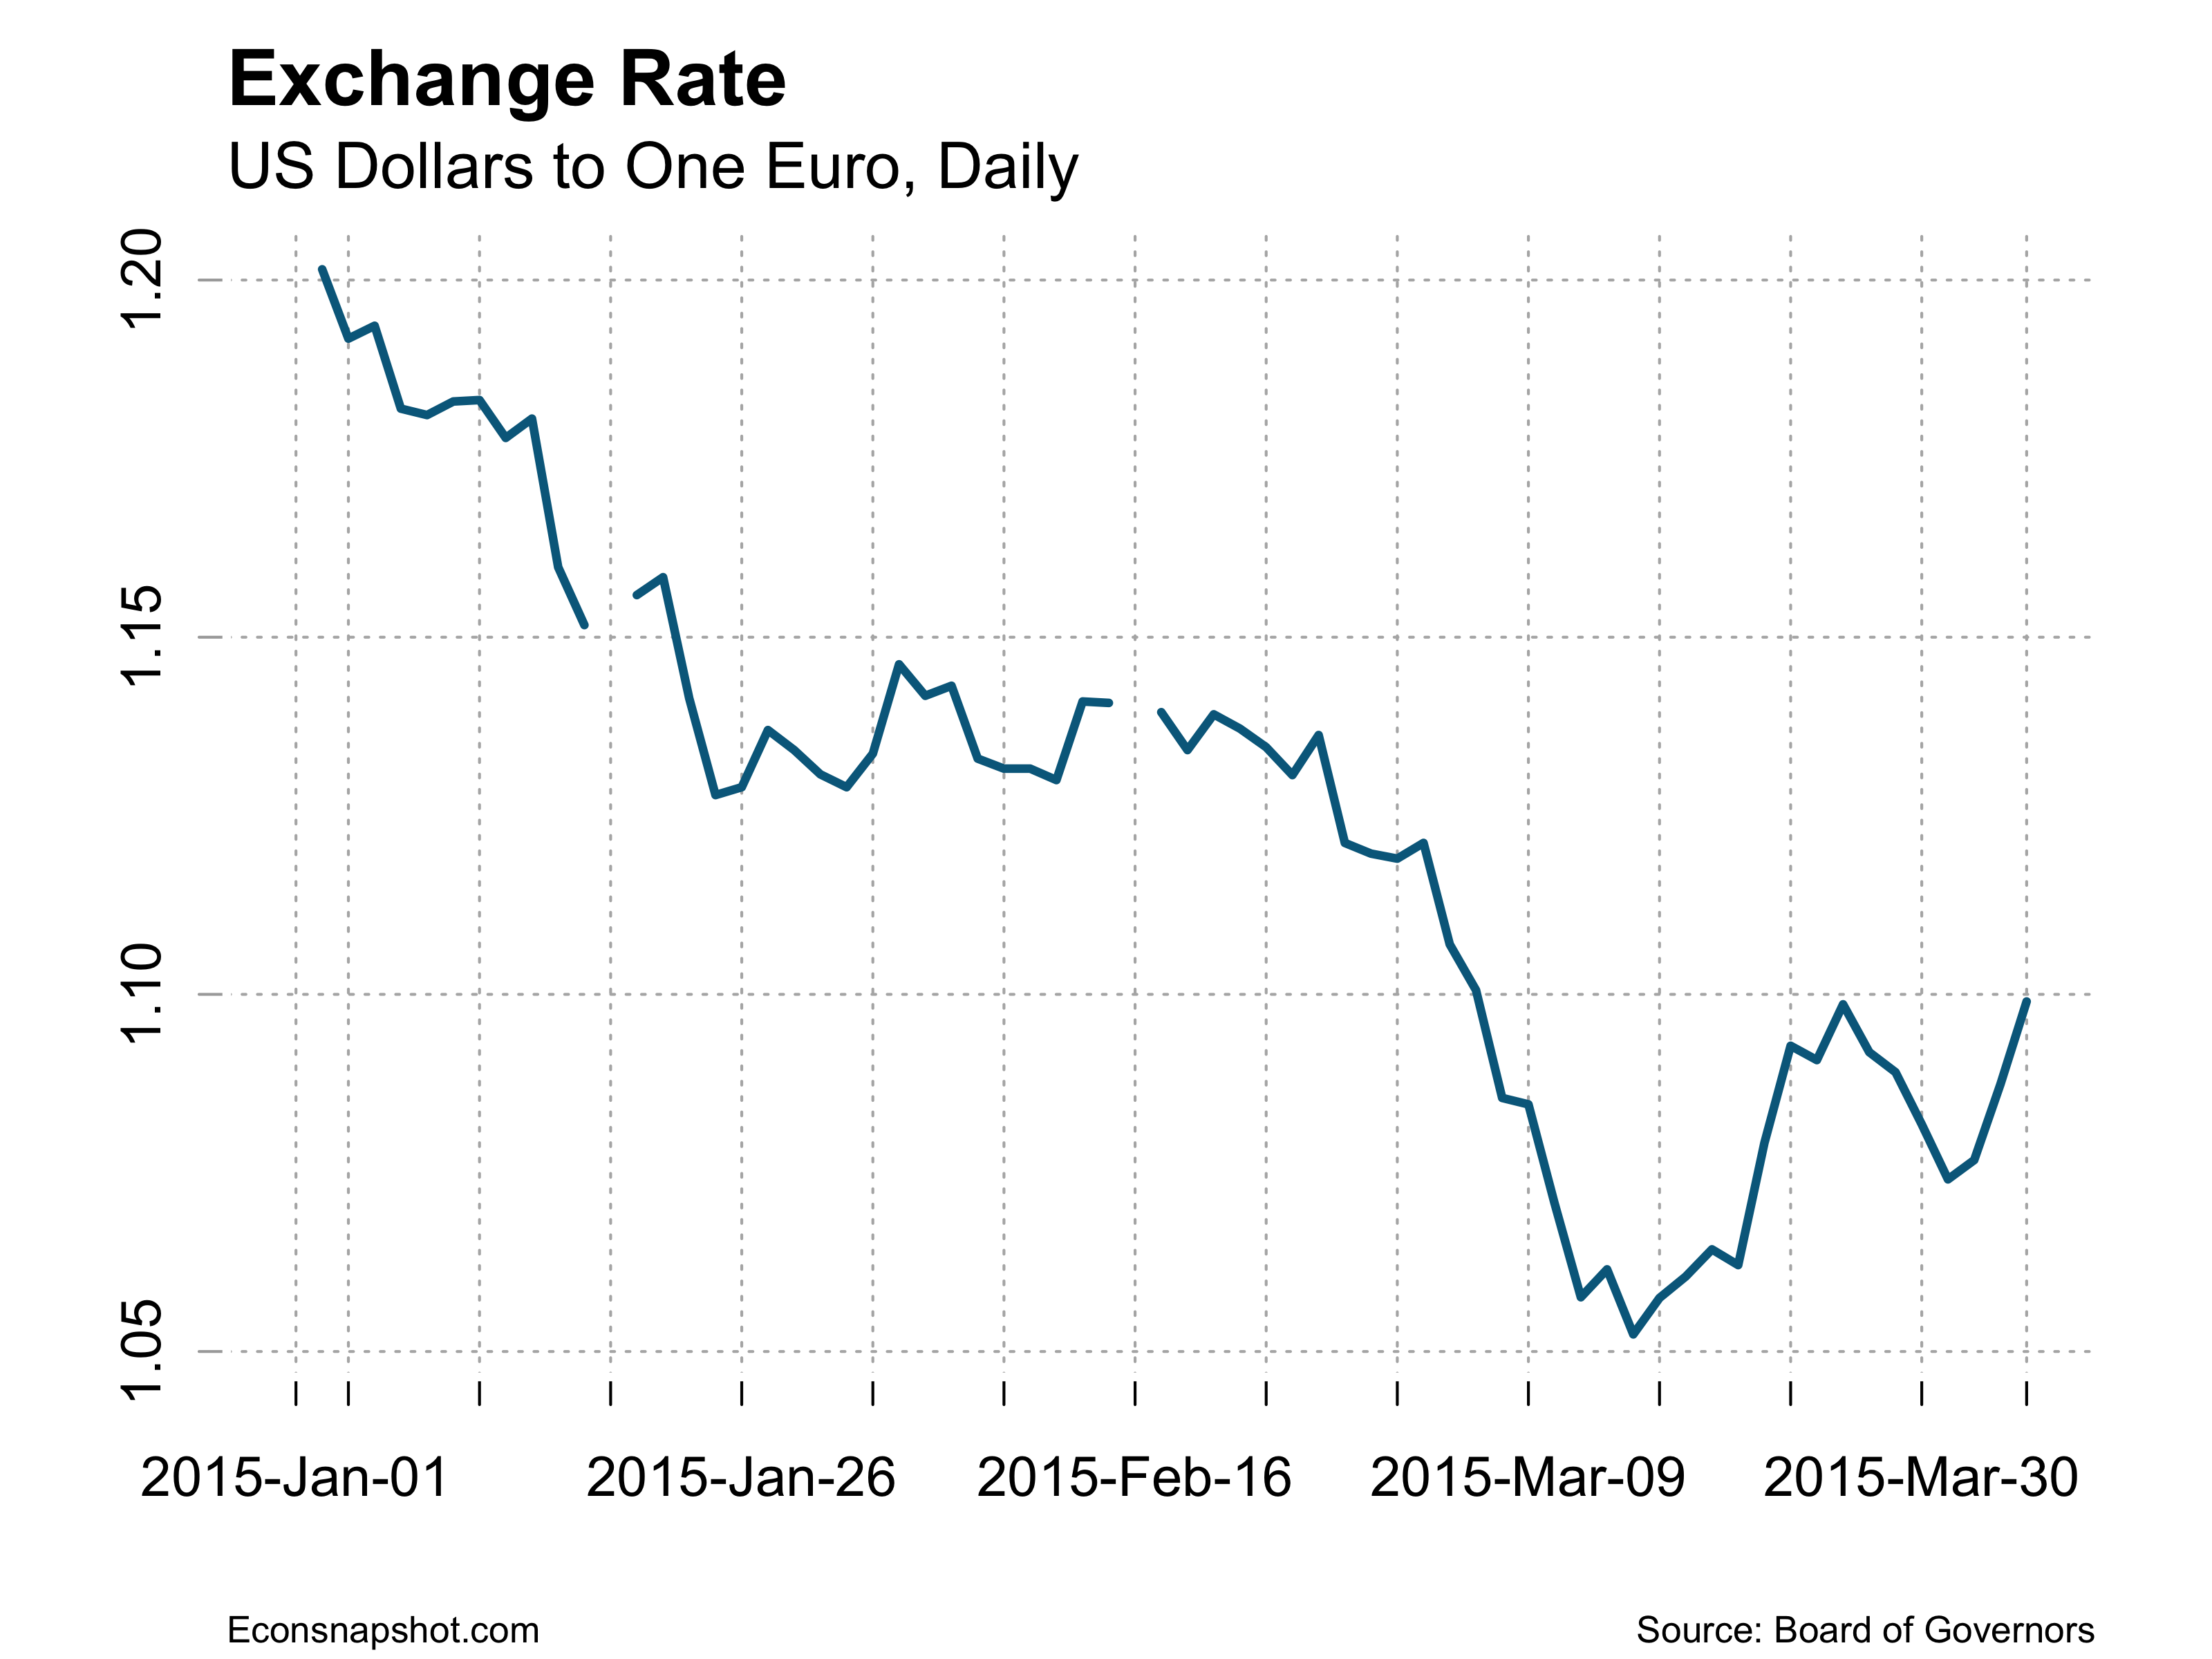
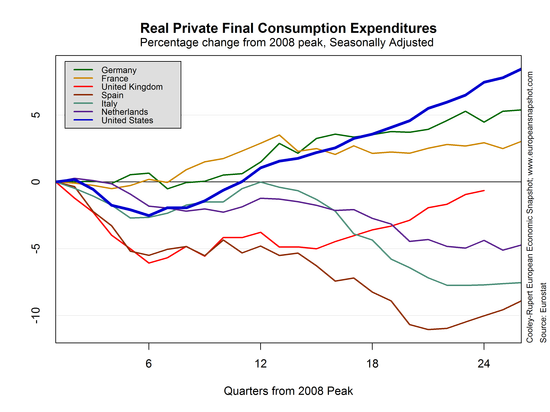
By Thomas Cooley, Charlie Nusbaum, and Peter Rupert
Roughly three months ago, Spain’s Banco Popular was bought and saved from complete failure by the Santander Group after it faced a bank run and a total collapse of its stock price. The cause of Banco Popular’s problems can be traced back to the 2008 financial crisis. As several others have recognized (here), Banco Popular maintained a portfolio of almost $40 billion in non-performing loans (i.e. loans over 90 days past due) in its home-market. Compared to its 2016 balance sheet totaling over $100 billion in loans, these failing assets constituted a significant fraction of its portfolio. In light of these events, it is useful to look at the health of the European Banking sector to see if it will be a serious impediment to our optimistic take on European growth and promising signs for the EU economy, detailed in our previous post, or worse, leading to a new financial crisis for Europe.
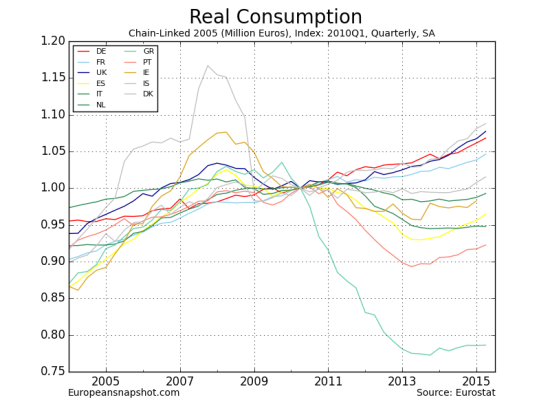
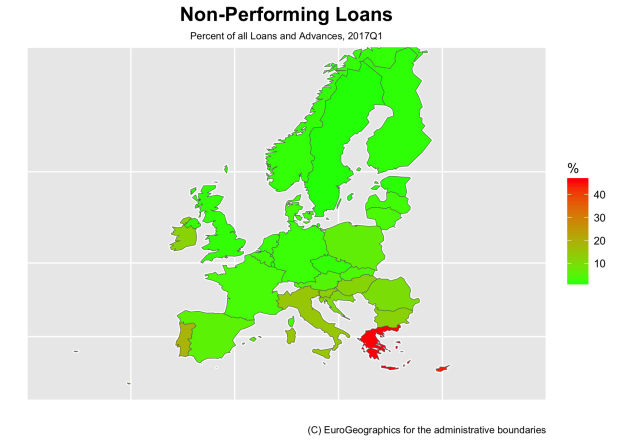 Given that Banco Popular’s problems can be linked in part to its massive portfolio of non-performing loans, this is a natural place to start for the rest of the Union. Indeed, it is evident that the Greek and Cypriot banking sectors are a great risk to their respective economies. During the first quarter of 2017, non-performing loans composed 46% and 43% of all loans in Greece and Cyprus, respectively, numbers above those of even Banco Popular prior to its crash. To get a better picture of the rest of Europe, we removed these two countries from our map.
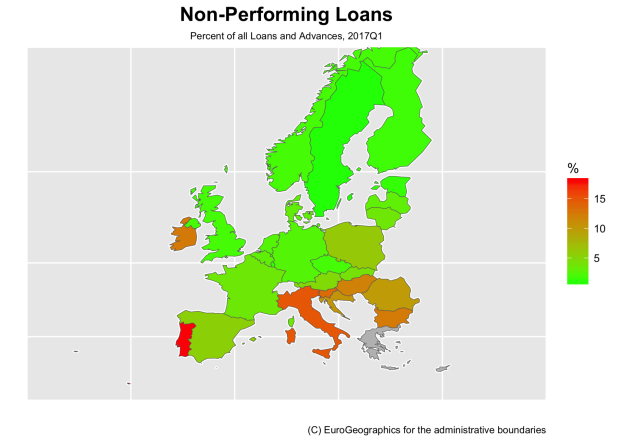
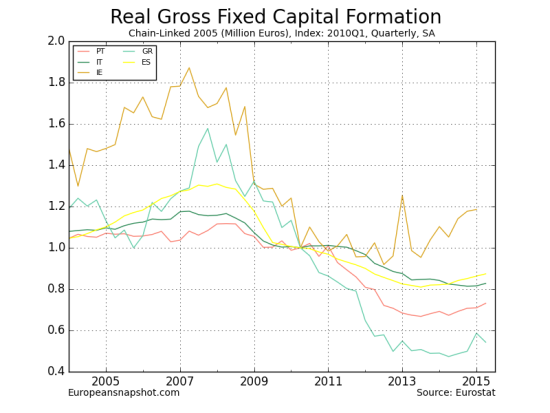
It is clear that Greece and Cyprus are not the only countries that are at risk. Portugal, Ireland, and several Eastern European countries hold a relatively high proportion of non-performing loans. Together, these countries display non-performing loan (NPL) ratios of roughly 10.5%-18.5%. While not nearly as worrisome as an NPL ratio of 40%, these banking sectors pose a potential risk, particularly when compared to the 1% NPL ratio seen in the United States. Moreover, Spain seems to be slowly correcting course, decreasing their NPL ratio from 6.3% to 5.5% over the past year. While they still have work to do, Spain appears to be on the right track.
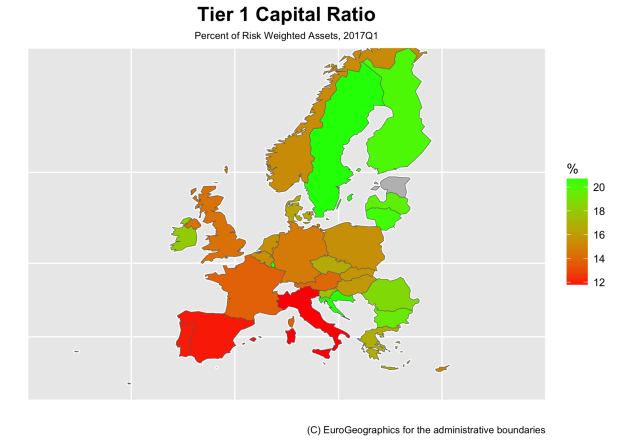
A bank’s ability to absorb losses is also of great concern, here we consider the tier 1 capital ratio, measured as the ratio of retained earnings and shareholder’s equity to total risk-weighted assets. Furthermore, because Estonia’s 37% capital ratio washes out the rest of the graph, we have omitted it. Clearly, Portugal, Italy, and Spain need to do more. With tier 1 capital ratios of roughly 11.5%-12%, they fall well below the EU average of 14%. While they remain both compliant with the Basel III capital requirements for the EU and comparable to three of the six largest US banks, we believe that they should continue to improve this measure in light of shaky profitability indicators that we discuss below. Ireland and the other Southeastern countries, however, seem to have recognized their questionable positions with tier 1 capital ratios closer to 18%-19%.
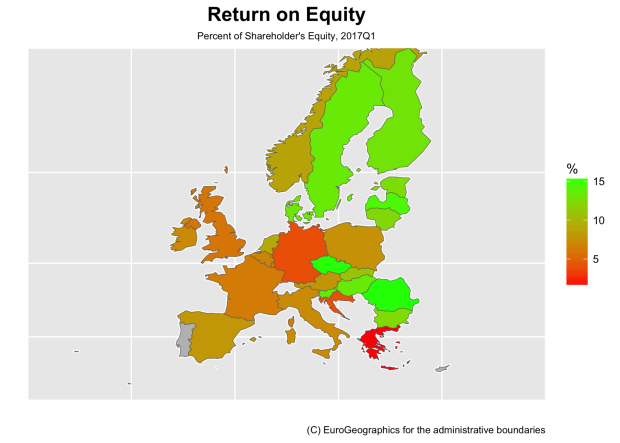
Several European areas show signs of little to no profitability as well as measured by the return on equity (ROE). To better contrast the remainder of the EU, we have omitted Portugal and Cyprus as they display a ROE for 2017Q1 of -3.2% and -1.2%, respectively. Coupled with their high proportion of NPLs, these abysmal profitability numbers show that Portuguese and Cypriot banks may be in serious trouble. It is also evident that Greece’s 1.3% ROE needs to improve to compensate for their failing loans. While it may seem that Greece is improving due to its 9 percentage point increase in ROE since the end of 2016, there may be a strong cyclical component at work here. Indeed, Greece displayed an almost identical ROE for 2016Q1, but saw large negative returns for the rest of the year. Italy and Ireland, on the other hand, seem to be doing about average in this department, with returns of roughly 7% each. Interestingly, Germany also shows meek returns of only 3.9%. While this is up 1.7 percentage points from this time last year, it is surprising nonetheless. Only the Eastern and Northern EU countries outperformed the 9% average ROE for U.S. banks.
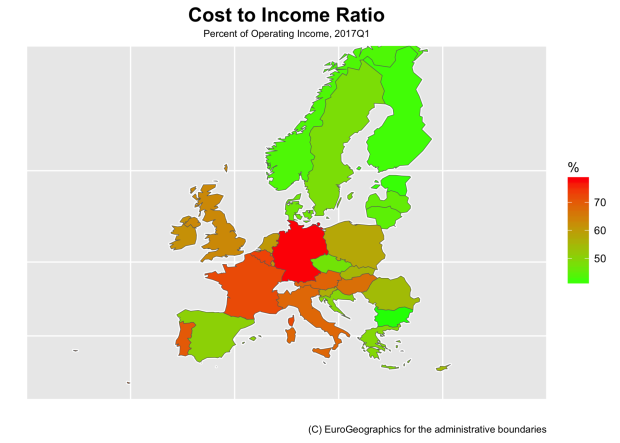
Digging a little deeper, we find that the Greek and Cypriot banking sectors may be in the early stages of a self-correction. With an operating cost-income ratio of only 49% and 54%, respectively, they fall well below both the EU average of 64% and the U.S average of 59%. Portuguese data again indicates trouble with a cost-income ratio of 70%, whereas Irish banks again seem to be in the middle of the pack. Germany is once again surprising in terms of operational efficiency with a cost-income ratio of almost 78%. Though this measure has decreased almost 50 percentage points since 2015, it highlights the need to keep a watchful eye on German banks should the previously detailed risk indicators take a turn. The same can be said for France.
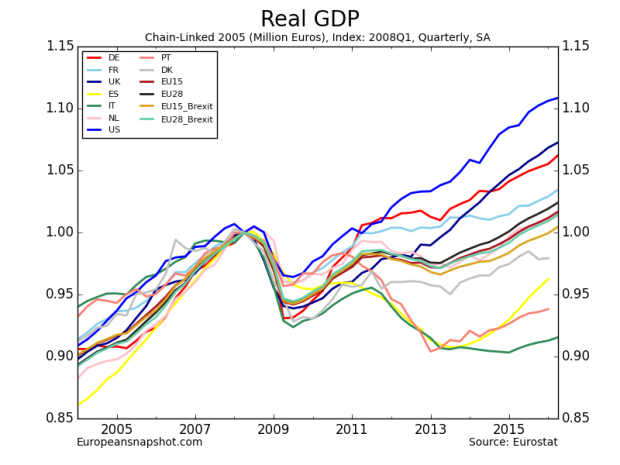
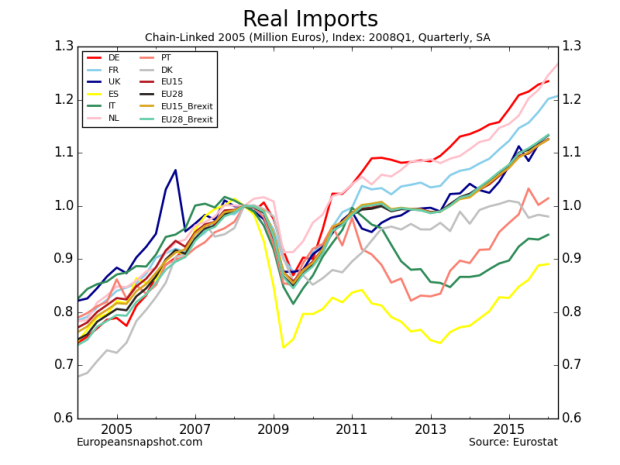
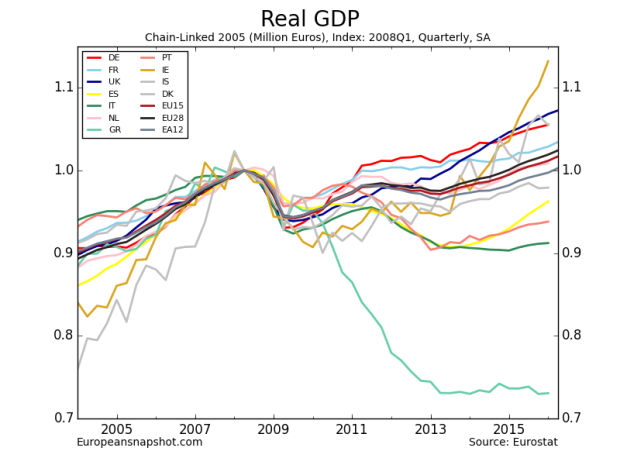
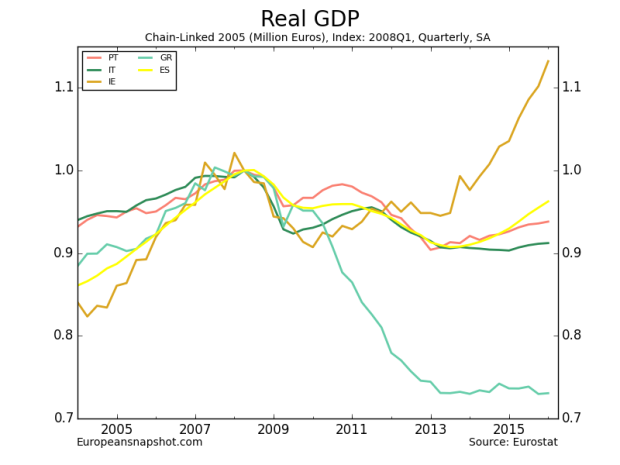
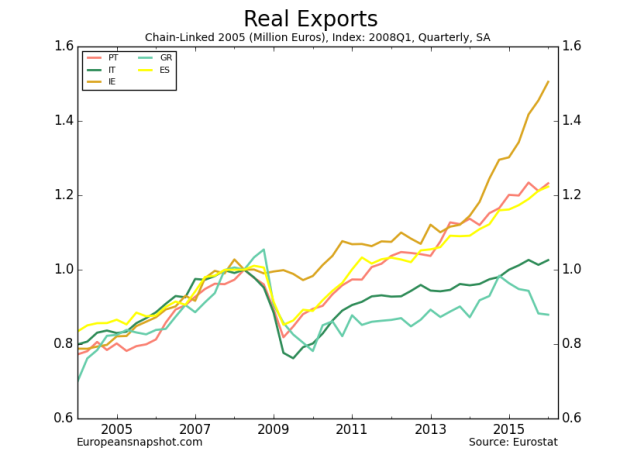
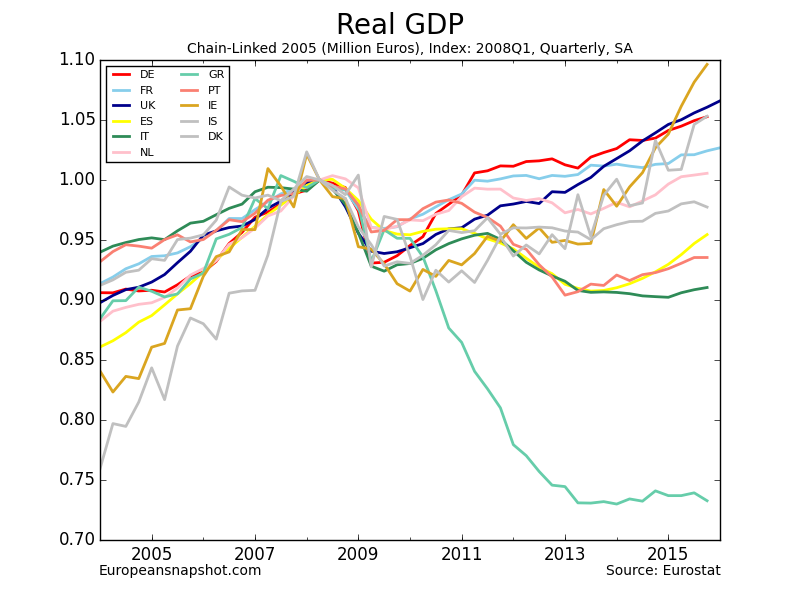
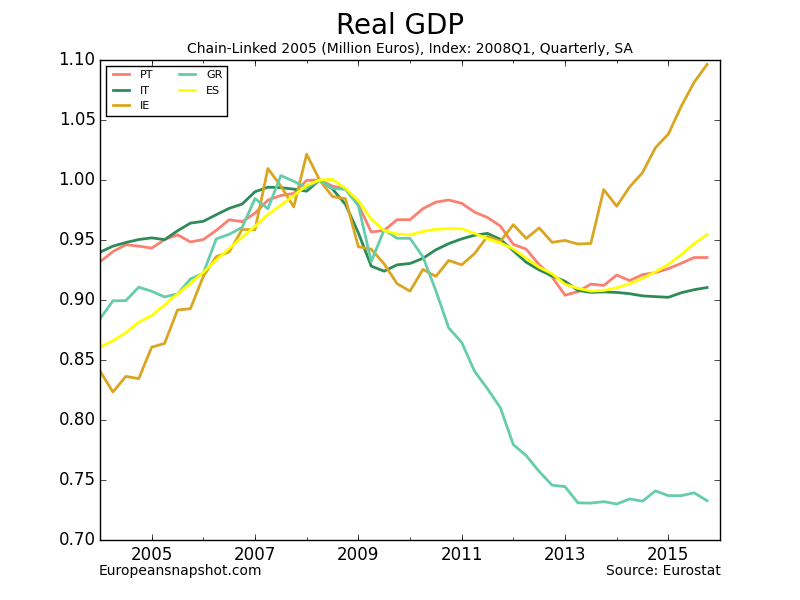
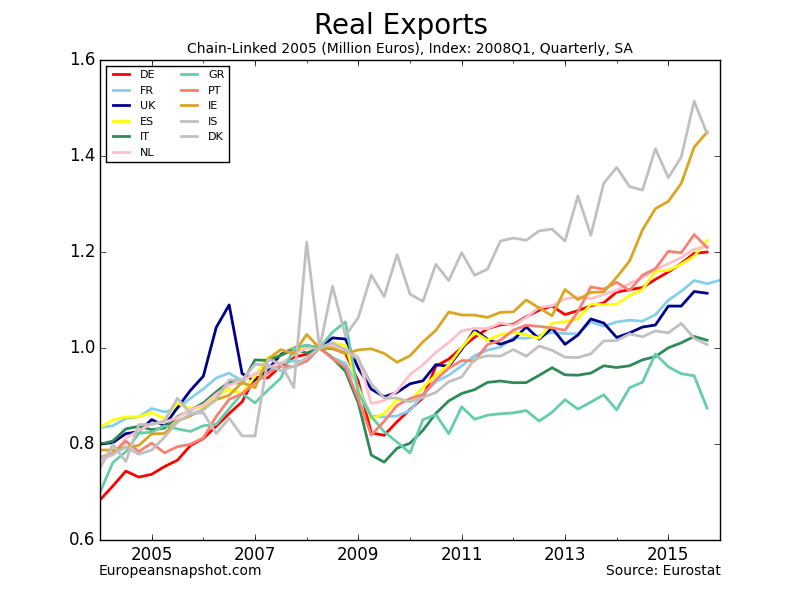
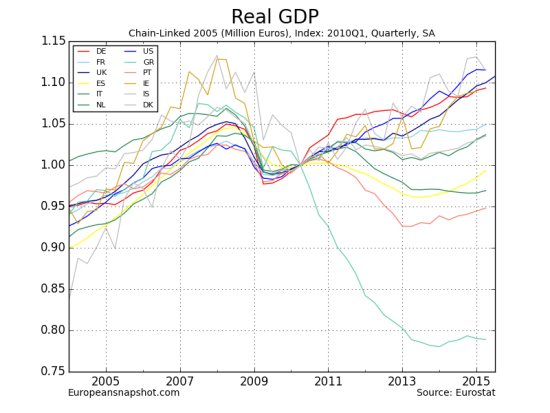
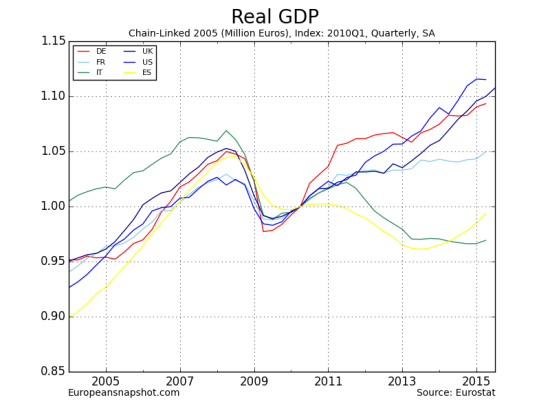
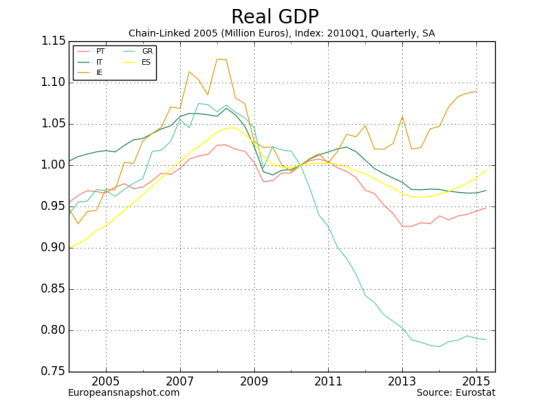
While many 2017Q1 GDP aggregates suggest a good year for the EU, the banking sector warrants concern. Portuguese, Greek, and Cypriot banks show a need for immediate worry in almost every indicator of financial health. Moreover, Irish and Italian banks show potential signs of trouble on the horizon, though the danger does not seem imminent. Banks in the rest of the EU seem to be doing relatively well, though Germany and France could improve from an operational efficiency standpoint.