by Tom Cooley, Charlie Nusbaum, and Peter Rupert
For several quarters now, there have been signs of trouble for many European economies, including the biggest ones. In earlier posts we highlighted the impact that trade and policy uncertainty may have on growth (here) and the strain that weak banking sectors place on European economies (here). Some of these concerns have been realized. But which margins are most affected by this slowdown? As is evident below, however, this phenomena seems to be concentrated in the Western European economies. Hence, we focus on Europe’s four largest economies to investigate this question.
In our country pages, we discussed the 2011-2013 slowdown extensively. From 2013 to mid 2017, the “Big Four” began accelerating in terms of growth. Growth in France, Italy, and Germany maintained an upward trend during this time period. After 2017Q4, however, growth trends for these three have reversed in remarkable fashion. Indeed, year-over-year GDP growth in France, Germany, and Italy has fallen by 1.9, 1.2, and 0.9 percentage points, respectively, over the past year. The United Kingdom has not faced the same type of trend reversal. Instead, year-over-year growth in the United Kingdom has slowly declined from its 2014Q4 peak of 3.07%. The UK slowdown continued this quarter, with year-over-year growth falling to 1.33%.
Short term growth for these economies presents a similar picture. While quarterly GDP growth in the UK has shown moderate declines over the past 3 years, that of France, Germany, and Italy shows a more sharp decrease. In fact, Italy has posted negative quarterly growth of -0.13% and -0.22% during 2018Q3 and 2018Q4, respectively. Germany “rebounded” from its -0.20% quarterly growth in 2018Q3 to 0.02% in 2017Q4. While CEPR adopts the NBER view that two-consecutive quarters of growth does not itself constitute a recession, the performance of these countries over the past two quarters will almost certainly be a focus for CEPR’s Business Cycle Dating Committee given the optimism of their last report.
To determine which margins are most affected at this point in the slowdown, we rely on the expenditure identity:
Y = C + I + G + NX
Here, Y is output, C is personal consumption, I is investment, G is government consumption, and NX is net exports. Given that output growth has slowed, it must be the case that one or more of these values has also deviated from trend.
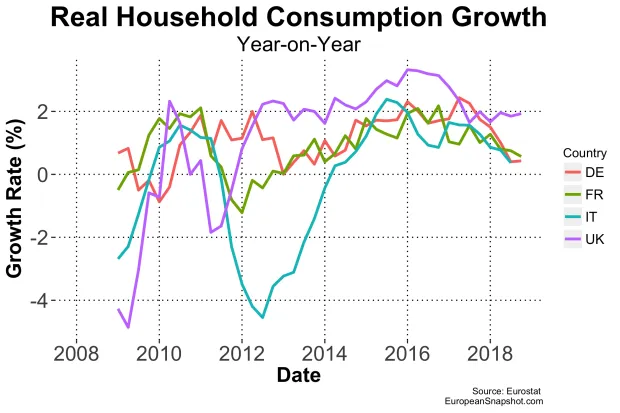
Personal Consumption
Household consumption is often one of the first signs of economic slowdowns. Indeed, recall the circular flow diagram. This simple diagram shows that all expenditures (output) are balanced out by an equal amount of income receipts similar to a T-account. As a result, declines in output should be reflected in declines in aggregate income and thus aggregate consumption, depending on marginal propensities to consume.
Below, we see that real household consumption has steadily risen for each of the Big Four since their most recent troughs. Excluding Italy, each country has more than recovered from the Great Recession. Italian personal consumption on the other hand remains roughly 3% below its pre-recession levels.
Growth in household consumption, however, seems to have slowed in Germany, France, and Italy. Consumption growth peaked in Germany and France in 2017Q2 and 2016Q4 at 2.44% and 2.18%, respectively. Both have seen persistent declines since. Italian consumption growth has also seen a sharp decline since 2017Q3 following a brief recovery in this measure between 2016Q4 and 2017Q1. United Kingdom consumption growth, on the other hand declined from a 2016Q1 peak of 3.32% to 1.65% in 2017Q3, but has remained just under 2% since.
Investment
A second potential sign of the downturn is a decline in investment. Below we show real fixed capital formation, a measure of fixed capital investment. Note that these 2018Q4 flash estimates for Germany and Italy are not yet available. Each country has shown persistent increases since their respective troughs. The United Kingdom has seen a decline in fixed capital formation beginning in 2017Q4.
Recent German and French investment growth peaked at 4.3% and 5.5% in 2017Q2 and 2017Q4, respectively, and has declined ever since. Italian investment growth remained on the rise until 2018Q3.
Investment in fixed capital has indeed showed signs of slowing. In the United Kingdom, it has even declined. Moreover, the timing of this decline coincides largely with the European growth slowdown. This suggests that declines in capital accumulation are in fact one important source of this slowdown.
Government Expenditure
Government expenditures have continued to increase in Germany and France. Italian and UK government consumption, on the other hand has remained constant since 2016Q1.
Despite continued increases, growth in German and French government consumption has declined. The starkest growth decline is in Germany, which has fallen from its peak of 4.78% in 2016Q2 to 1.73% in 2018Q3. The deceleration of French government consumption began more recently, decreasing from 1.52% in 2017Q3 to 0.92% in 2018Q4.
These declines in government expenditure growth may be an effort to stabilize rising government debts, with the exception of Germany. Instead, Germany has steadily decreased the relative size of its public debt. The decelerating its government expenditures will certainly aid in continuing this trend.
Trade
Finally, declining output growth me be reflected in declines in net export growth. The graph below shows monthly exports between the Big Four European economies and China, the rest of the EU, and the United States. Excluding the United Kingdom, there is a persistent upward trend in exports among these countries and their trading partners. UK exports experienced large gains in 2013 and 2014, but leveled off shortly thereafter. Germany has experienced the smallest growth in exports, but also the least volatility in its exports throughout the period.
Net exports display a similar story. Here, a negative index implies a trade deficit for that month whereas a positive index indicates a trade surplus. Here again, net exports are largely trending upwards and at least not decreasing by a substantial degree. The exception is the United Kingdom, where net exports with all of its trading partners have shown a slight downward trend.
Taken together, these pictures do not yet show any clear signs of the economic slowdown. Given that there do not seem to be deviations from trend beginning around 2017Q4, we conclude that trade has not yet been affected by the downturn.
The Labor Market
While not explicitly found in the expenditure approach equation, the circular flow diagram shows that labor markets are tightly linked to output fluctuations. Below, we show the employment to population ratio for 20-65 year olds. Note that only 2018Q3 data is currently available for this measure. The employment to population ratio has been on the rise in all countries. Germany and the United Kingdom boast the largest relative working population with employment to population ratios of 79.7% and 78.6%, respectively. Italy is weakest in this regard with only 63.1% of 20-65 year olds maintaining employment. Of note is that there have been no significant deviations from trend over the past year among the Big Four.
A direct corollary of these trends is the fact that the unemployment rate has continued to fall. While there has been a slight uptick of 0.1% in the United Kingdom and a leveling out in France, the unemployment rate in Germany and Italy has continued to decline.
One key friction in labor markets is that it takes time to find work, leading to structural unemployment. The rate at which those searching for jobs receive offers may discourage “marginal searchers” from participating in the labor force. One way to investigate worker-firm matching in the labor market is through a Beveridge Curve, which plots the job vacancy rate against the unemployment rate. Economic theory tells us that the higher the ratio of vacancies to unemployed job searchers, the higher the arrival rate of job offers.
Below we show the Beveridge Curve for the EU excluding the United Kingdom as more historical data is available than for the EU28. The graph is qualitatively identical for the EU28. Data limitations force us to rely on the EU as a whole as a proxy for the Big Four. Clearly, this Beveridge Curve indicates that the vacancy rate is very high relative to the unemployment rate. Notice, however, that the red portion of this curve has shifted outward relative to pre-2013 data. This indicates that match efficiency in the labor market has declined. That is that for any particular vacancies to unemployment ratio, there are fewer worker-firm matches. This decline in match efficiency may reflect a number of things such as differences in the skills required by job openings and those searching for work, geographical mis-match between the unemployed and vacancies, etc.
Despite the decrease in match efficiency, however, it is difficult to see the recent downturn in this picture. Taken together these pictures suggest that the labor markets of these four economies have remained largely unaffected by the growth slowdown.
Final Take
France, Germany, Italy, and the United Kingdom have all experienced a sudden slowdown in growth over the past year or so. The effects of the slowdown (or even negative growth in some cases) have already shown themselves in household consumption and to a lesser degree, investment growth. Trade and the labor market have largely remained unaffected so far. It is unclear, however, whether these two markets are robust to the source of this current slowdown or that their fragility is masked in current data.
Several factors contribute to our anxiety. Europe, like the U.S., is faced with large sources of uncertainty. Brexit continues to cast a long shadow, Italy’s GDP growth has been in negative territory and government debt is becoming increasingly problematic at about 130% of GDP. The rise of populist governments has splintered the fragile consensus about the European vision. Increasingly the monetary union feels like a straight-jacket to some of the underperforming economies. One thing is certain: the next few years in Europe will be interesting to watch.