By Thomas Cooley, Ben Griffy, and Peter Rupert
To View This Article in Portuguese go to https://www.homeyou.com/~edu/conto-de-tres-europas. Our sincere thanks to Artur Weber https://www.homeyou.com/~edu/
One of the great hopes for the European Union and particularly the Eurozone was that removal of national barriers and the free flow of capital and labor would lead to gradual convergence of economic outcomes and well-being. To some extent that was true up until the financial crisis, but as Warren Buffett once said, “When the tide goes out you see who has been swimming without a bathing suit.” For some European economies, the Great Recession is firmly in the rearview mirror. But now that data for 2016 is complete we have a pretty good picture of the widely different fortunes in Europe. What we see is that European countries can be divided into three groups, largely along geographic lines. The larger economies of Northern Europe have recovered to levels exceeding the beginning of the recession. The smaller economies of the periphery, especially the South and the East, have struggled, still lagging behind their pre-recession levels for most of the important indicators. And then there’s Greece, whose only positive post-recession has been to keep economists and pundits from referring to the other periphery economies as tragedies. There isn’t really a way to spin it: Greece is in a lot of trouble.
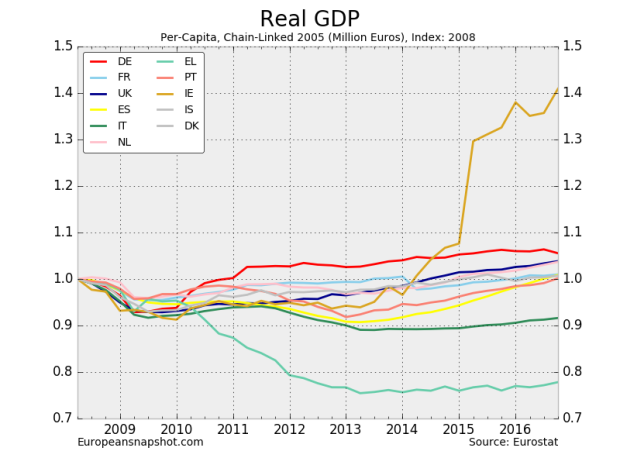
The northern economies, Germany, the UK, France, and the Netherlands, have all seen timid but consistent growth following the recession. The star of the region has been Ireland, but looks can be deceiving. Much of Ireland’s growth is as a result of global firms relocating their intellectual capital to take advantage of lower Irish taxes. In 2015 Ireland measured growth at 26% much of it illusory because of the relocation of corporate headquarters and intellectual capital. It is more instructive to look at Europe without Ireland as the following chart does.
Portugal and Spain make up the middle of the pack, having just returned to pre-recession levels. Italy has seen GDP per-capita fall by nearly 10 percent since the recession. Each of these three countries experienced what looks like a “double-dip” recession, recovering and then bottoming out again in 2012Q4 and 2013Q1. They are all showing signs of recovery, though still lagging behind their northern peers. And at the bottom is Greece, behind by more than 20 percent, and showing few, if any, signs of recovery.
The labor market looks equally grim and again the labor markets reflect the ongoing structural weakness of the periphery economies and the utter collapse in Greece.
. 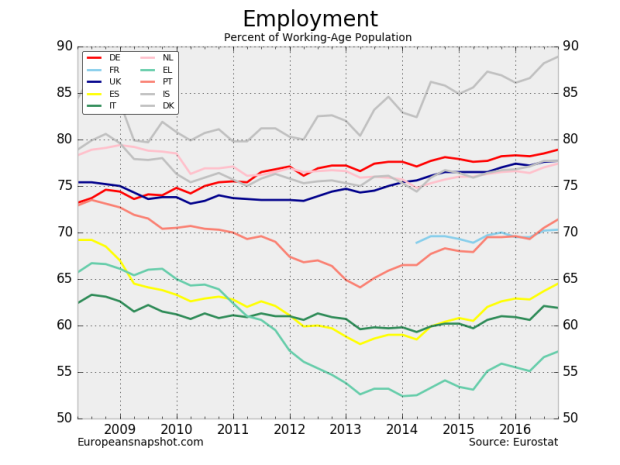
The same basic groupings of countries show up. Geographically, this pattern is even more clear:
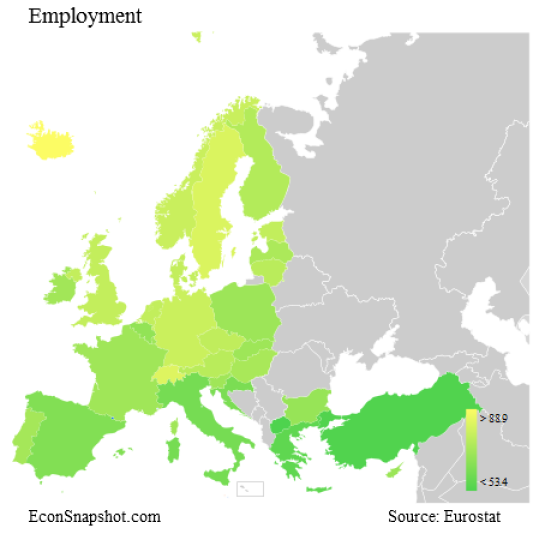
That’s a 10 percentage point decline in employment for countries that are already hurting. Unemployment looks equally as bad:
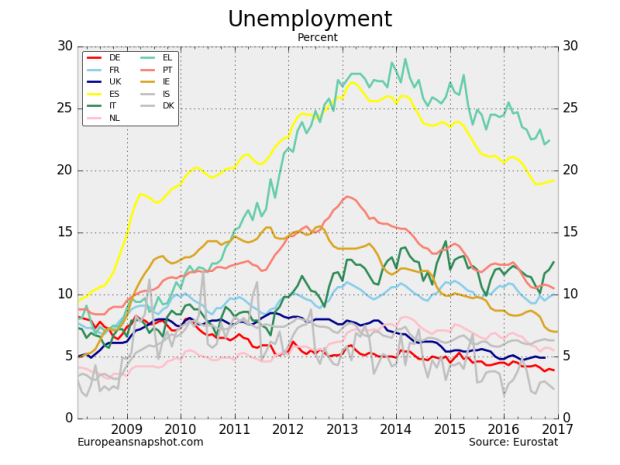
Spain only fell below 20 percent unemployment midway through 2016, and Greece is still well-above 20 percent unemployment.

Once again, the picture gets worse as you move South.
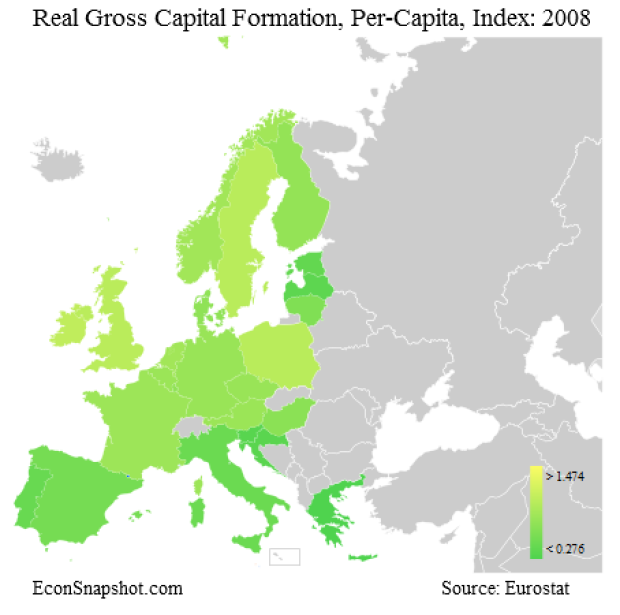
Perhaps the most alarming picture one can present is the path of real gross capital formation. Investment is the bedrock of economic growth. In the stronger economies it has recovered , or nearly so, to pre-crisis levels. In the middles group it seems to have settled at about 70% of pre-crisis level. In Greece it has fallen by an almost unbelievable 75%.
Quarterly investment in Greece is now 30 percent of its pre-recession level. That’s what might be expected from a catastrophic war, except there was no war.
Given these divergent fortunes it is clear that the economic recovery from the crisis has been at best uneven. This makes the stability of the European Union and the Eurozone that much more fragile because one of the chief benefits of unity is not being realized. We should expect to see more evidence of this divergence in the rise and success of populist movements in Europe. Brexit was only the beginning.
Interactive Maps:
NIPA: GDP, Consumption, Government, Fixed Investment, Imports, Exports
Labor Market: Unemployment, Employment-Population Ratio


