by Thomas Cooley, Peter Rupert, and Charlie Nusbaum
Third quarter GDP numbers for Europe have been finally been released and they indicate that the EU is performing better than expected. EU GDP grew at an annualized rate of 2.42% during the third quarter, slightly down from the 2.83% growth experienced last quarter. Compared to 2016Q3, however, EU GDP rose by 2.6%, 0.1 percentage points higher than predicted. Moreover, this quarter marks the highest growth numbers for the European Union since 2007. This compares favorably to the United States, whose GDP grew at an annualized rate of 3.2% in the third quarter.
Indeed, 15 of the 28 member nations performed stronger than the EU as a whole. Ireland, Romania, Malta, and Luxembourg posted the highest annualized growth at 17.8%, 11%, 7.7%, and 6.8%, respectively although for reasons cited in earlier posts Ireland’s numbers are an anomaly.. Denmark is the only country in the EU whose economy contracted.
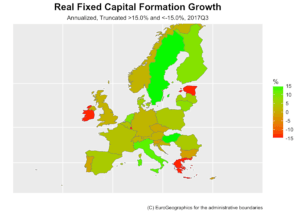
EU investment in fixed capital also saw substantial growth. Year-on-year fixed capital investment growth increased from 3.3% to 4.3% during 2017Q3. In contrast, year-on-year fixed capital investment growth in the United States was only 3.8%. Annualized quarterly fixed capital investment growth, however, decreased from 8.24% in 2017Q2 to only 4.47% in 2017Q3. The worst performing countries in this regard were Ireland, Luxembourg, Estonia, and Greece, who decreased investment by 83%, 44%, 27%, and 22%, respectively. This stark decline in investment is likely to inhibit future growth potential in these countries compared to the rest of the EU. Malta, Hungary, and Sweden on the other hand boasted investment growth of over 50%, 18%, and 16%. These countries have been truncated in the above graph to facilitate comparison among the remaining countries.
Among the unadjusted countries displayed above, Italy, the Netherlands, and Finland increased investments the most with growth rates of 12.6%, 10.1%, and 9.43%, respectively. This is particularly good news for future Italian growth potential as its GDP remains below pre-crisis levels and its recovery has been one of the most sluggish in Europe.
European households also continued spending more during 2017Q3. The EU as a whole saw annualized real household consumption growth of 2.0%. The highest consumption growth was seen in Romania and Portugal, where household expenditures increased at an annualized rate of 15.2% and 5.6%, respectively. Lithuanian households on the other hand decreased expenditures at an annualized rate of 7.5%.
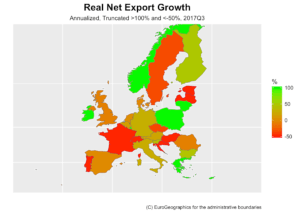
2017Q3 saw the greatest increase in European exports to date this year. During the third quarter, exports in the EU grew at an annualized rate of 3.6%. Imports on the other hand grew by 4.1%, resulting in a decrease of net-exports of roughly 6.5%. In contrast, the Euro Area saw net exports grow by just over 7.0%. This net export growth included 15 of the 28 EU member nations. Switzerland, Estonia, France, Croatia, and Latvia faired the worst with net exports declining by more than half at an annualized rate. On the other hand, 6 countries including Ireland, Cyprus, and Greece saw their net exports more than double at an annualized rate. As we’ve mentioned before, it is also instructive to investigate the year-on-year growth rate for net exports as trade tends to vary throughout the year.
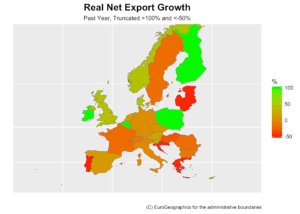
The story for some is different when comparing to this time last year, however. Indeed, when comparing to 2016Q3, Greece, and Lithuania no longer seem to be doing as well. In fact, Greek and Lithuanian net exports halved. In contrast, the year-on-year growth rates suggest an upward trend in Finish, Belgian, and British net exports.
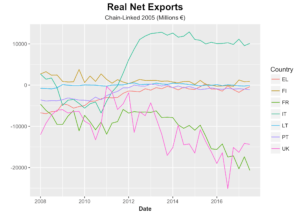
Investigation of the time series bolsters the previous point. In particular, Finnish net exports have been on a slow decline since 2013. Interestingly, a similar picture emerges for the UK. Over the past year, the United Kingdom saw their net exports decrease by roughly 26%. This downward trend started several years before France. Moreover, while it may be too early to tell as Britain remains in talks with the EU over Brexit, there does not yet seem to be any major long-term effects emerging on the UK’s international trade as a result of the vote to leave the EU over a year ago. It also seems as though Italian net exports are slowly following their surge in 2012.
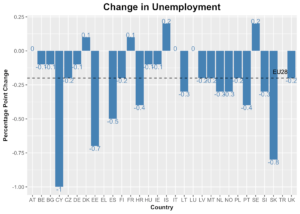
The labor market in the EU also continued to improve. The EU as a whole decreased unemployment by 0.2 percentage points. Moreover, only Denmark, France, Iceland, and Sweden saw increases in unemployment.
Of these four countries, only France maintained an unemployment level above that of the 7.5% average across the EU. But, unemployment remains very high in Italy (>11%) and we have had to leave out Spanish unemployment numbers in the above graph as their 16.8% unemployment rate washes out the rest of the picture. Furthermore, the 2017Q3 average unemployment numbers for Greece are not available. The most recent unemployment data for Greece showed an unemployment rate of 20.6% as of August.
Job vacancy rates, often used a measure of unmet labor demand, also increased since this time last year. The EU as a whole saw this measure grow by 0.3 percentage points (17.6%). According to this statistic, the only countries with decreasing unmet labor demand are Greece, Cyprus, and Romania, who saw their job vacancy rates decrease by 0.3, 0.1, and 0.2 percentage points. The country with the largest increase in unmet labor demand was the Czech Republic, whose job vacancy rate increased by 1.0 percentage point.